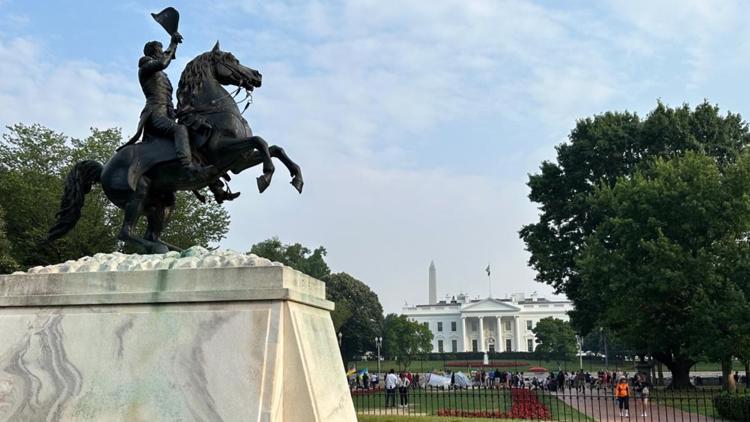
WASHINGTON — July is the warmest and wettest month of the year in the nation’s capital, according to NOAA. And over the last decade July has been a particularly wet month.
That’s what led to a 0.6” jump in D.C.’s July rainfall average of 3.73” from 1981-2010 to 4.33” for the current period of 1991-2020, which NOAA uses for weather averages.
Not only has July been a wet month over the last 10 years in D.C., it’s also been a very warm month. Six of the District's 10 warmest July’s have occurred since 2010.
Higher temperatures have a larger capacity to hold water vaper that can, in turn, lead to higher rainfall totals. Consequently, Washington, D.C. has had 11 July days with at least an inch of rain, including four days with at least 3” of rain, since 2017.
According to the EPA, warmer temperatures related to climate change contribute to more frequent, heavier rain events: “Average annual precipitation in the DC area has increased by 5 to 10% in the last century, but precipitation from extremely heavy storms has increased by more than 25% across the eastern United States since 1958.”
Ironically, the EPA study also points out that warmer temperatures will lead to more evaporation and that, in turn, could exacerbate drought conditions. That’s significant since the DMV is currently experiencing moderate to severe drought conditions, according to the latest Drought Monitor Index.
DC’s 10 wettest July days (Source: NOAA)
1. 4.69” (July 9, 1970)
2. 4.35” (July 22, 1969)
3. 4.25” (July 30, 1878)
4. 4.12” (July 30, 1876)
5. 4.05” (July 9, 2022)
6. 4.00” (July 21, 2018)
7. 3.68” (July 5, 1908)
8. 3.44” (July 8, 2019)
9. 3.37” (July 13, 1922)
10. 3.31” (July 28, 2017)
DC's rainiest July days since 2017 (Source: NOAA)
1. 3.31” (July 28, 2017)
2. 4.00” (July 21, 2018)
3. 2.79” (July 17, 2018)
4. 3.44” (July 8, 2019)
5. 2.04” (July 7, 2020)
6. 1.89” (July 23, 2020)
7. 1.27” (July 1, 2021)
8. 1.15” (July 9, 2021)
9. 4.05” (July 9, 2022)
10. 1.38” (July 16, 2022)
11. 1.33" (July 14, 2023)
WATCH NEXT:


