Statewide, Virginia averaged 56-percent turnout among registered voters during the 2016 Presidential Election – a 15-percent jump in turnout compared to the 2014 midterms. With 2018 being one of the most anticipated midterm elections in a generation, see where turnout was highest – and lowest – in cities and counties across the state.
Explore the map below to see turnout data for Virginia from the 2016 Presidential Election and 2018 Midterm Election. Counties will be color-coded by voter turnout rate as election results come in:
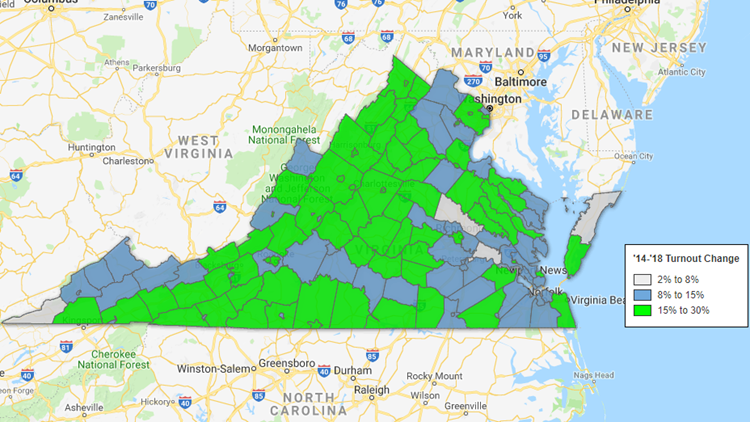
Compared to 2014, turnout was up across the board, with 82 of the state's 133 counties and independent cities seeing turnout increases of 15 percent or more. In Charlottesville City, nearly double the amount of voters cast a ballot on Tuesday compared to the 2014 midterms.
Use the map below to see the increase in turnout in Virginia's cities and counties compared to the 2014 midterms:
MORE MIDTERM 2018 COVERAGE
- Unprecedented turnout in Virginia’s Prince George’s County caused four voting locations to run out of paper ballots. The shortage caused wait times to stretch into the four-hour range, until additional ballots were finally issued. FULL STORY


