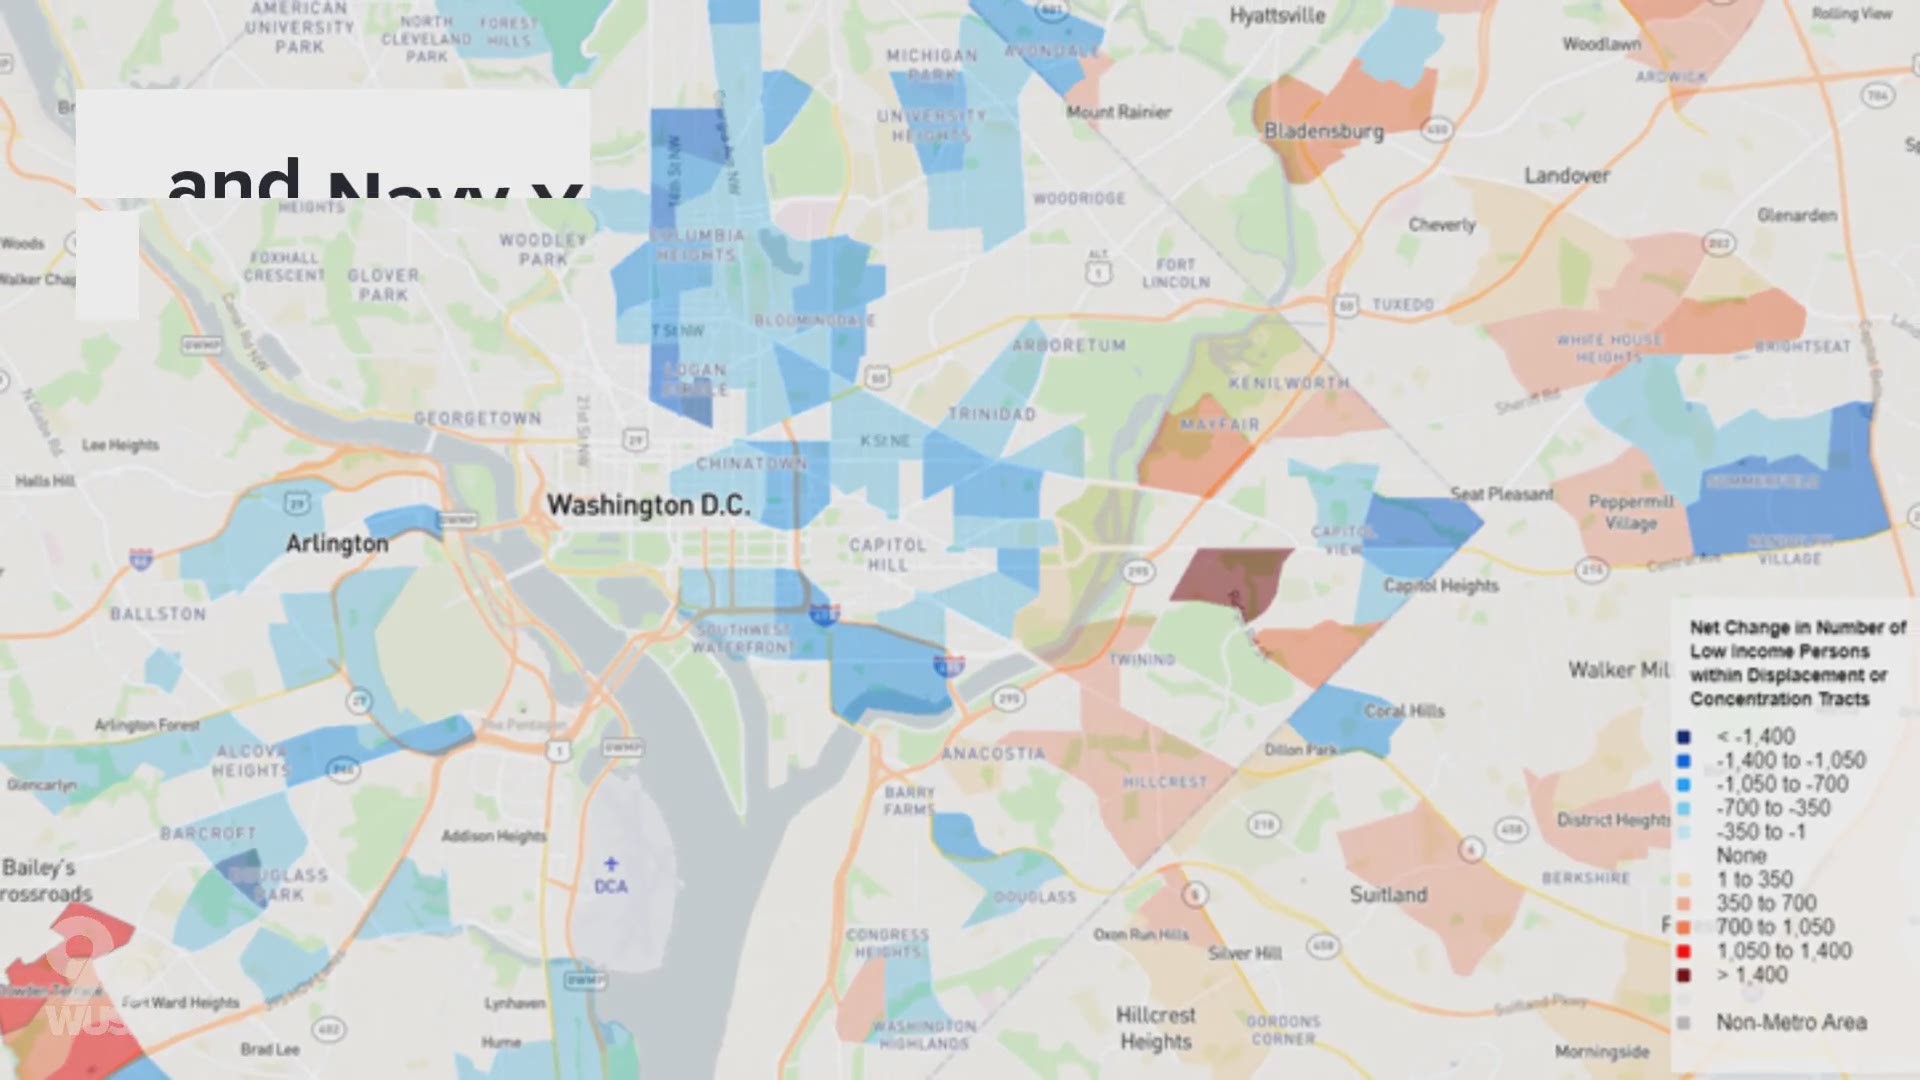
WASHINGTON -- Washington, D.C. has experienced the worst gentrification in the country since 2000 among large cities, according to a new study by the Institute on Metropolitan Opportunity on how American neighborhoods have changed.
The study, titled “American Neighborhood Change in the 21st Century,” was produced by researchers at the University of Minnesota Law School and released this month.
In it, researchers looked at income data for 2000 and 2016 for every census tract in the country to classify them in one of four categories:
- Growth – Tract is economically expanding and has low-income population growth
- Low-income displacement – Tract is economically expanding and has low-income population decline
- Low-income concentration – Tract is economically declining and has low-income population growth
- Abandonment – Tract is economically declining and has low-income population decline
The report defines “low-income” as anyone below 200 percent of the federal poverty level – which, in 2016, would mean individuals that make up to $47,520 annually or a family of four with a household income up to $97,200.
According to the study, D.C. had the highest rate of economic displacement – or gentrification – of all large cities in the U.S., with nearly 36 percent of its population living in areas experiencing “strong displacement.”
The displacement has been most pronounced in Wards 1, 2 and 6, particularly in the area bounded roughly by the Petworth and Logan Circle neighborhoods to the north and south, and the Adams Morgan and Bloomingdale neighborhoods to the west and east.
The strongest low-income displacement in the city, however, occurred in Navy Yard, which saw its overall population rise to 251 percent of its 2000 number while simultaneously seeing low-income residents as a percentage of its population drop from 76.9 percent in 2000 to 20.8 percent in 2016.
Institute on Metropolitan Opportunity: Low-Income Displacement and Concentration Map
At the same time, Wards 7 and 8 have experienced the opposite trend, with multiple neighborhoods seeing what the report classifies as low-income concentration. The Fort Dupont area saw the largest concentration, with low-income residents rising from 52.9 percent of its population in 2000 to 77.3 percent in 2016.
In D.C., and nationwide, black residents were “significantly more likely than the population at large to be located in areas that have experienced decline,” according to the report. In all five census tracts located between 16th and 14th streets and Massachusetts Avenue and Spring Road NW, for example, the total black population decreased from 2000-2016, for a total loss of nearly 2,500 black residents. During that same period, the white population increased in all five census tracts, for a total growth of just under 6,000 residents.
Navy Yard, the neighborhood which saw arguably the city’s most intense gentrification over the time period studied, lost 531 black residents while adding 2,828 new white residents.
In the Fort Dupont area, the neighborhood actually saw a slight decline in its white population even as the overall population increased by nearly 20 percent.
While D.C. might be the most extreme example of a city experiencing gentrification, it’s hardly atypical, according to the report.
“By far the most common form of neighborhood change is low-income concentration,” the report says. “In the 50 largest metros, tracts that have experienced strong low-income concentration include about 36.5 million people, and are predominately suburban.”
In the greater D.C. area, Arlington and Alexandria saw significant low-income displacement as the number of middle-high income residents increased. Maryland counties immediately surrounding D.C. to the east and northeast tended to see a pattern of low-income concentration.

